Introducing RotoTracker+

Premium features for all Bronze, Silver and Gold subscribers.

Date & Cohort Graphing

A whole new dimension to understanding your DFS performance. Dynamically build your own charts across any date or cohort report, choosing one or two performance metrics — whether it be total entries or contests, profit, total won or total wagered, to average score, ROI and ITM.
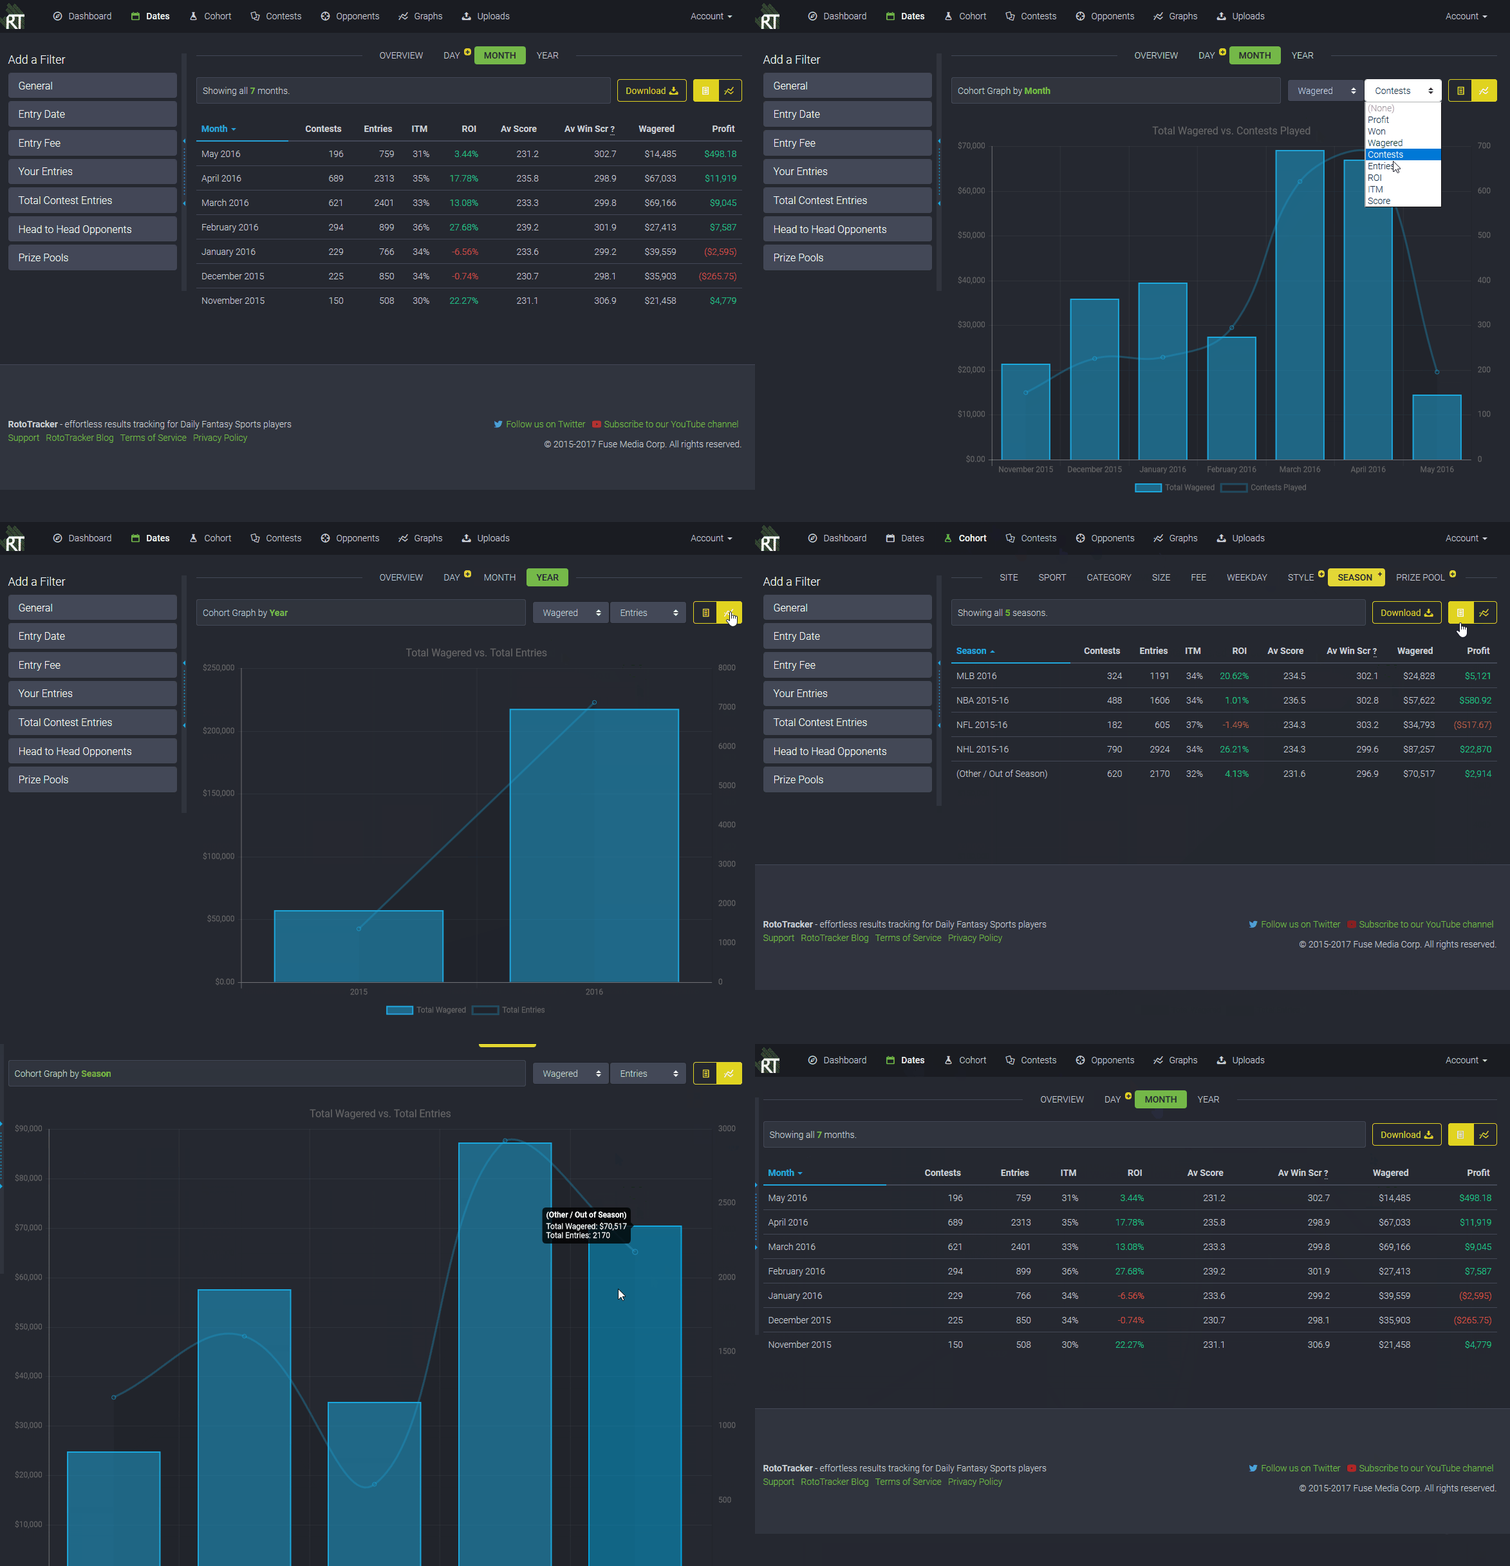
Cohort graphing on RotoTracker+

Advanced Cohort Reports

  • Use the new Day Report to view, export and graph your performance each day. Using filters and charts, the day report is perfect to understand your total daily wager, day-to-day performance, and how you do each day against a single opponent.
  • Prize pool cohort will tell you how you perform as you try bigger GPPs.
  • Season cohort let's you see how well you do each season, split up by your each major sport.

CSV Export on Every Report

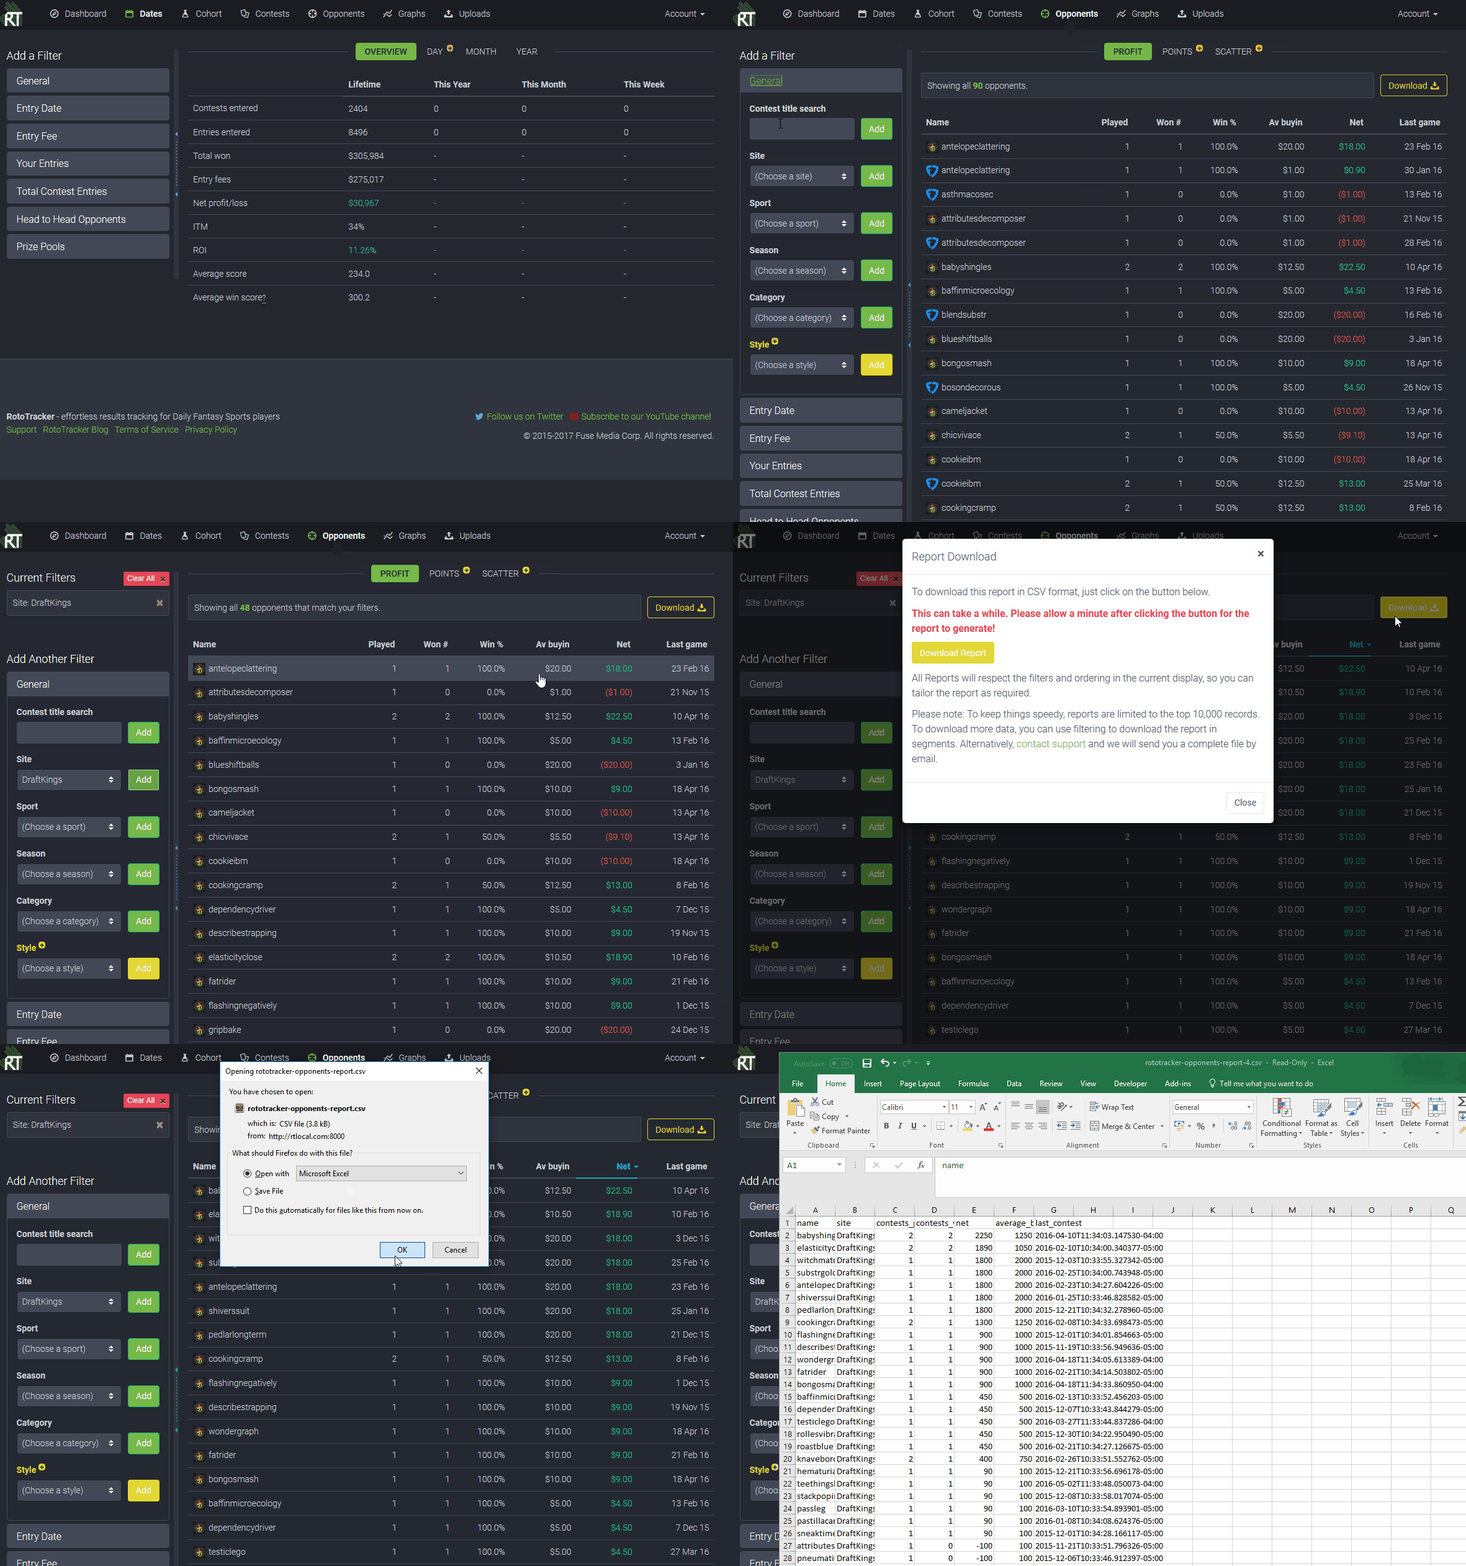
Download every RotoTracker report — from your list of contests and entries, to opponent reports and every cohort — as a spreadsheet file instantly.

  • Load data into a spreadsheet for your own custom analysis.
  • Offline copies of every report for your own backup.
  • Every report can be customized with all our filters as well as column ordering, so you can export exactly what you need. Files of up to 10,000 lines are supported, or you can contact us if you need bigger exports!
CSV download on RotoTracker+
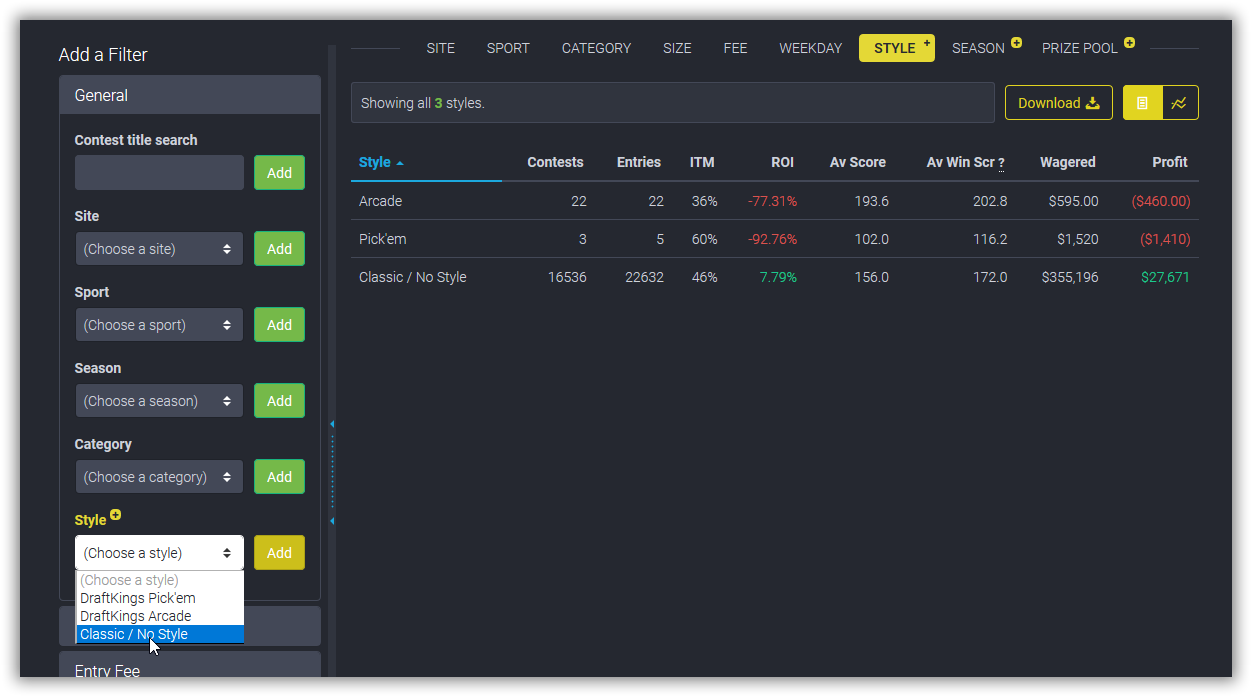
Style cohort and filter on RotoTracker+

Full Support for DraftKings Arcade, Pick'em, Showdown and Tiers Formats

DraftKings has expanded its offer of DFS contests to a wide variety of new variants, including Arcade, Pick'em, Showdown (and Showdown Captain Mode), Tiers, and Non Late Swap. RotoTracker is unique in that it understands all these formats, and RotoTracker+ customers can view their performance across each style and apply a specific filter to dig deeper into each one.

Learn more about DraftKings Styles »

Opponent Points Report for FanDuel

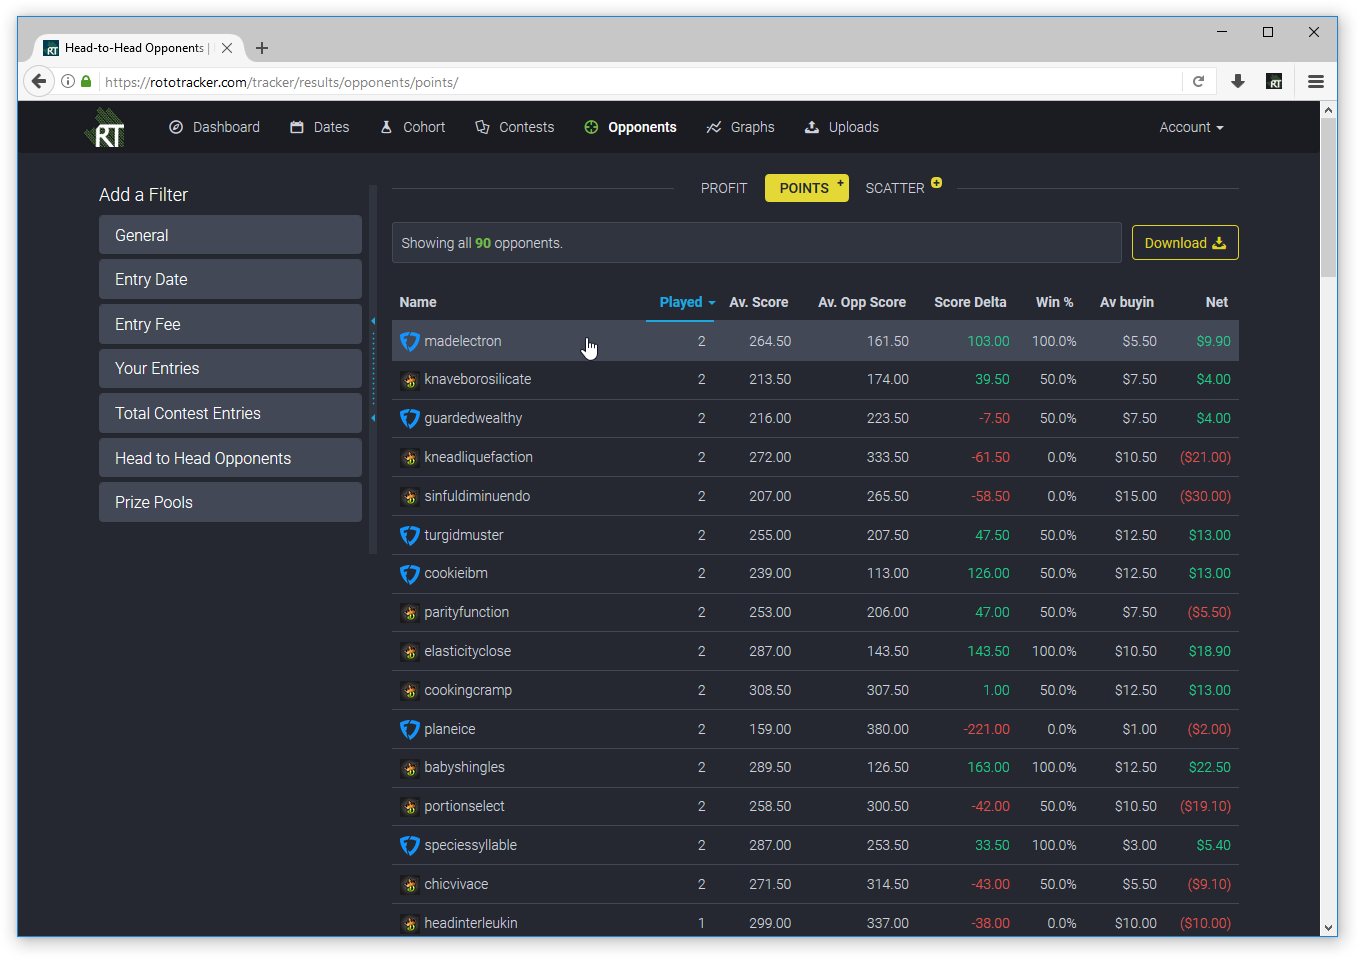
To better understand your performance in head-to-head contests, a new points report shows you on average how both you and your opponent score when you play together, and the average score difference.

This can then be plotted on the opponent scatter plot. For high volume RotoTracker users, a line-of-best-fit can tell you what winrate you can expect with a given point score difference.

Learn more about the RotoTracker+ Opponent Report Features »

Style cohort and filter on RotoTracker+